How to Make a Pie Chart in Adobe Illustrator
This page may contain links from our sponsors. Here’s how we make money.
Making a pie chart in Adobe Illustrator may sound a little complicated if you' are used to making pie charts elsewhere've never done it before, but it's actually not difficult at all. It's super easy to make pie charts in Illustrator, and you get to explore new ways to customize your pie chart to make it stand out.
In this article, we'll learn how to make different pie charts and stylize or customize them in Illustrator.

A pie chart is a visual representation of data. It helps one to manage, organize and present the data as a percentage of the entire data.
Pie charts are used for advertisements, infographics, market research, etc. For example, if you have a clothing business needing the percentage of your customer categories, you can make a pie chart showing the percentage of men, women, and kids categories.
You just have to put the data in the designated category, and your pie chart will show you the data as a percentage of a whole. It helps the viewers or readers to have a more precise and better understanding of data of different categories in an interesting, appealing way.
Pie Graph Tool in Illustrator
Before we get started, Let's learn about the Pie Graph Tool. The pie graph tool is located in the left toolbar. Unfortunately, this tool has no shortcut key, and you may find it under the Column Graph Tool. Just right-click on the column graph tool to see the pie graph tool in the drop-down menu.

Method 1: Making a 2D Pie Chart in Illustrator
To make any pie chart, you need the Pie Graph Tool. In this method, we'll make a simple 2D pie chart.
Step 1
Create a new document. Before going to the next step, ensure your toolbar has the advanced setting. Otherwise, you won't find the tool you need in the toolbar.

Step 2
Select the Pie Graph Tool from the left toolbar and click on the artboard to create a pie chart.

Step 3
As you clicked on the artboard with the pie graph tool activated, you'll have a graph box where you'll input the size you want for the pie chart. Input your preferable width and height for the pie chart and click Ok.

Step 4
Now you have a half-done pie chart and a table next to it. All you need to do is input the data in the table. In the first row, write down the attributes and input the value for each attribute in the second row.

Step 5
When you're done with inputting data in the table, click on the checkmark in the top right corner of the table. And your pie chart is ready.


Method 2: Making a 3D Pie Chart
In this method, you'll make a normal 2D pie chart using the previously mentioned method, and then turn it into a 3D.
Step 1
Make a normal 2D pie chart using the Pie Graph Tool. Follow the steps of method one given above.

Step 2
Select the pie chart and ungroup it so that all parts are separated.

Step 3
From the top toolbar, choose Effect and select 3D and Material. There will be a drop-down menu where you will get 3D options. From the drop-down menu select Extrude and Bevel. You can also choose 3D Classic, which will give you more control over customizing your 3D object.

Step 4
Once you select your 3D option, your pie chart will turn into a 3D pie chart. Next to it, you'll have a dialog box where you can change the value according to your preferences. Here we made the 3D using the first option. First, we'll change the depth. This depth will determine the extrude level.

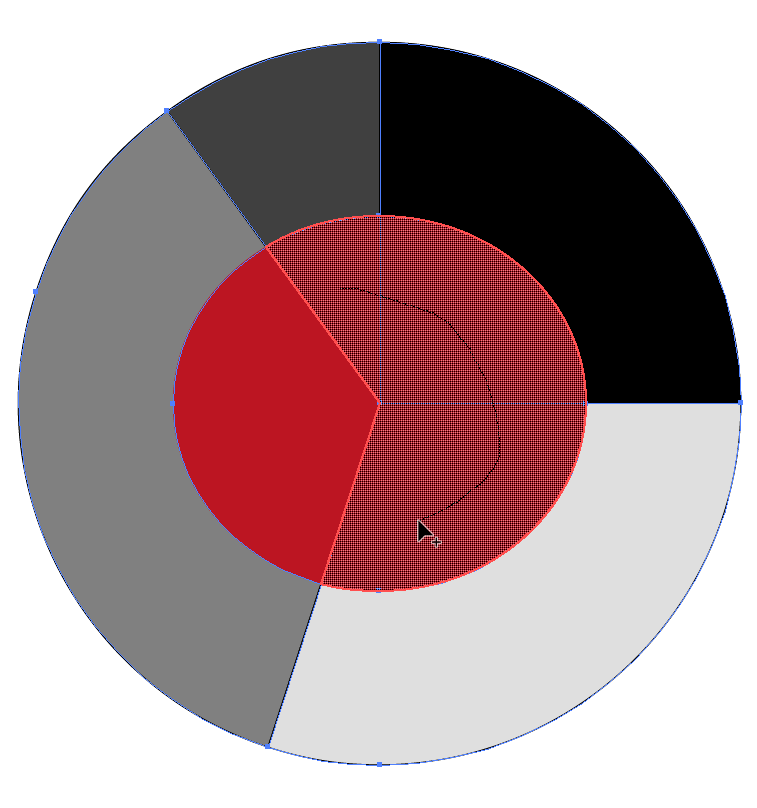
Step 5
Change the rotation from the rotation section. You can change the rotation from three angles in this part. Your 3D pie chart is ready. You can also separate the segments a little to make it look better.

Method 3: Making a Donut Pie Chart
To make a donut pie chart, you must make a 2D pie chart first.
Step 1
Make a pie chart using a pie graph tool. Ungroup the pie chart.

Step 2
Select the Ellipse Tool (E) from the left toolbar and draw a circle in the middle of the pie chart. Once you place the circle, select both the pie chart and the circle using the Selection Tool.


Step 3
Select the Shape Builder Tool from the left toolbar. The shortcut key for the Shape Builder Tool is Shift + M.

Step 4
When you select the Shape Builder Tool, you can see the divided parts of the pie chart underneath the circle. Now, click and draw with the Shape Builder Tool to combine these parts within the circle.


Step 5
After combining the shapes, select the circle using the selection tool and delete it. Your donut pie chart is ready!


Editing a Pie Chart
Whether it's a 2D, 3D, or donut pie chart, it is not complete until you add some details to it. You can add colors, gradients, patterns, and whatnot. Or maybe you want to change the size or data of your pie chart.
Adding Color to a Pie Chart
If you want to add colors to a pie chart, you can't just select the pie chart and select a color. That way, the entire pie chart will have the color you selected.
Select the Direct Selection Tool. Using the direct selection tool select one part individually and then go to the Fill and select the color.
In the same way, you can add patterns to a pie chart. Choose your patterns from the Swatch panel.


Resizing a Pie Chart
Select the pie chart. Right-click on the window, go to Transform and select Scale. You will get a dialog box “Scale.” Change the percentage in the uniform box. If you want to reduce the size of the pie chart, you will input less than 100%, and if you want a bigger pie chart, change the value to 150% or 200%, or whatever you want


Editing Data in a Pie Chart
Select the pie chart and right-click on the window. From the right-click menu select Data. This will open a table where you can edit the data you previously input for the pie chart. Click on the green tick mark when you are done with editing.

This is for all today. I hope making pie charts in Illustrator seems simple after reading this article.